- Research article
- Open access
- Published:
Modelling developmental instability as the joint action of noise and stability: a Bayesian approach
BMC Evolutionary Biology volume 2, Article number: 11 (2002)
Abstract
Background
Fluctuating asymmetry is assumed to measure individual and population level developmental stability. The latter may in turn show an association with stress, which can be observed through asymmetry-stress correlations. However, the recent literature does not support an ubiquitous relationship. Very little is known why some studies show relatively strong associations while others completely fail to find such a correlation. We propose a new Bayesian statistical framework to examine these associations
Results
We are considering developmental stability – i.e. the individual buffering capacity – as the biologically relevant trait and show that (i) little variation in developmental stability can explain observed variation in fluctuating asymmetry when the distribution of developmental stability is highly skewed, and (ii) that a previously developed tool (i.e. the hypothetical repeatability of fluctuating asymmetry) contains only limited information about variation in developmental stability, which stands in sharp contrast to the earlier established close association between the repeatability and developmental instability.
Conclusion
We provide tools to generate valuable information about the distribution of between-individual variation in developmental stability. A simple linear transformation of a previous model lead to completely different conclusions. Thus, theoretical modelling of asymmetry and stability appears to be very sensitive to the scale of inference. More research is urgently needed to get better insights in the developmental mechanisms of noise and stability. In spite of the fact that the model is likely to represent an oversimplification of reality, the accumulation of new insights could be incorporated in the Bayesian statistical approach to obtain more reliable estimation.
Background
As a consequence of the stochastic nature of cellular processes, the development of any trait is disturbed by the accumulation of small random errors. This developmental noise (DN) may be counteracted by individual-specific buffering mechanisms that ensure a controlled development [i.e. Development stability (DS)] [1]. DS is not directly observable from the trait values but can presumably be measured by small random deviations from perfect symmetry of bilateral traits [i.e. Fluctuating asymmetry (FA)]. The underlying idea is that left and right sides of a bilaterally symmetric trait are under the control of the same set of genes and experience similar environmental conditions. Ideally, both sides should follow exactly the same developmental pathways leading to a perfectly symmetric morphology. Any deviation from symmetry is assumed to reflect failure to buffer development against random noise.
FA has been studies intensively in the area of evolutionary biology and conservation because FA could act as a general measure of the adverse fitness effects of environmental and/or genetic stress [2]. It is often postulated that all individuals experience noise during development irrespective of the levels of stress they experience. While controlled growth should be able to correct for these perturbations under ideal developmental conditions. Yet, under levels of stress, insufficient amounts of energy remain available to assure controlled stable development. The relationship between DS and FA on the one hand, and stress and fitness on the other hand, together with their genetic background has been the subject of many debates in the evolutionary literature. Many, but certainly not all, studies show a positive relationship between FA and stress at the individual and population level. These observations have led to the assumption that the unobservable DS decreases with environmental and/or genetic stress, and that DS may express individual (genetic) quality and population health [2]. Yet, because of many caveats in the literature, the generality of these associations has been questioned [3, 4].
The most appealing feature of FA as potential estimator of stress and fitness is that a biologically complex and poorly understood property (i.e. DS) can be estimated by simply measuring both sides of a bilaterally symmetric trait. In sharp contrast to this seeming lucidity stand statistical complexity, difficulties in interpretation and lack of a mechanistic approach [1, 5]. If we restrict our arguments to FA only – and neglect directional asymmetry and antisymmetry of which the link with DS is subject of many debates as well [1, 6, 7] – the controversy is the result of two phenomena. Firstly, levels of asymmetry are often small and measurement error biases FA-estimates upward. Repeated measurements on each side and mixed-model analysis yield unbiased estimates [8, 9]. Secondly, DS and DN cannot be observed directly and independently, and very little is known about the developmental mechanisms that lead to asymmetric trait expression (although progresses in this field have been made that [1]). Based on statistical arguments the association between individual asymmetry and DS is presumed to be weak [10–15]. Consequently, associations between FA and other factors underestimate the degree of association with DS. Yet, model assumptions have been challenged for both mechanistic [1] and statistical [13] reasons.
Whitlock [10] and Houle [12] have initiated the development of models that establish a link between FA and DS based on the normal assumption of DN. Yet, the terminology of the literature has been confusing. DS, developmental noise, developmental imprecision, developmental precision and developmental instability have been used interchangeably, sometimes to indicate the same process while they mean different things. Here we use DN to indicate the random process that causes a developing trait to deviate from its expected growth trajectory (given its genotype and environmental conditions). DS is the buffering capacity counteracting DN. The resulting developmental imprecision or developmental instability (DI) is the result of the joint action of DN and DS. Thus, FA relates positively to DN and DI and negatively to DS. Most importantly it should be noted that DS is the biological property of interest in this context since it refers to the feature of the individual.
The underlying assumption of the models that link FA and DS, is that DI is expressed as a variance where individual asymmetry can be regarded as a sample from a normal distribution with zero mean and variance equal to 2×DI [10]. Therefore, variation in asymmetry may be large in spite of little or no variation in DI [10, 11, 16], resulting in a downward bias of patterns in FA [10, 12]. This downward bias can be corrected for in two different ways. Associations between FA and other factors and heritabilities can be transformed using the so-called hypothetical repeatability (i.e. R, the proportion of variation in FA that is due to variation in the underlying DI [10, 11, 14, 15]). Or – making use of a latent variable model in a Bayesian context – estimates of slopes and heritabilities can be obtained directly, taking all sources of uncertainty into account [17].
The importance of the downward bias for heritabilities in DI, between-trait correlations and the association between DI and fitness was evaluated twice in the recent literature [15, 16]. Both papers reached different conclusions. Based on data from several large datasets, Gangestad and Thornhill [15] concluded that values of R are often small (+ 0.04). They subsequently concluded that a low heritability of FA or a weak FA-fitness association could still be the result of a much stronger effect in DI. Van Dongen and Lens [16] on the other hand concluded that values of R may be much higher in some cases, but observed that even in those cases heritabilities of DI remain low. Houle [13] indirectly challenged the latter conclusion. His analytical and numerical results showed that in order to obtain high values of R, coefficients of variation (CV) in DI should be unrealistically high (>100%) relative to morphological traits (CV typically between 2 and 20%) and fitness components (CV typically between 10 and 100%). Therefore, model assumptions may be incorrect [13].
In this paper we propose an alternative model which is a simple linear transformation of the previous one. Current models consider variation at the level of DI, the joint action of DN and DS [10–15, 17]. Yet, DS is the individual-specific trait of interest that is presumably related with stress and fitness. We therefore treat individual DS as the proportion by which DN is reduced resulting in an individual-specific value of DI. Our numerical simulations indicate that only small amounts of variation in DS are required to obtain high values of R. In addition, the relationship between variation in DS and R depends on the shape of the distribution of between-individual variation in DS. Thus, there is no simple and direct relationship between the amount of variation in DS and R. Nevertheless, the common feature of both models is the high skewness in the distributions of either DI [13] or DS (below). In a final section, a statistical framework is proposed that provides estimates of this distribution of DS. We apply the method to both simulated and real data.
Results and Discussion
A simple model of DN, DS and DI
We assume that in the absence of a mechanism that buffers development against random noise, developmental errors will accumulate and result in a phenotype that deviates from its expected value given the individuals' genotype and environmental conditions. Each developmental mistake is assumed to be independent of previous ones and to follow a normal distribution with zero mean and variance equal to σ2noise. It is important to note that these assumptions which also hold in previous models, may be an unrealistic oversimplification of real developmental processes [1, 13]. Representing development as a high number of small discrete growth events, any trait value is a sample from a normal distribution with mean equal to the expected trait value and variance the sum of the many small errors over a range of growth events:
The asymmetry of a bilaterally symmetric trait then follows:
N(0,DN) (2)
where developmental noise is defined as the cumulative effect of mistakes:

DS, the process that buffers development against mistakes, can be incorporated in this model as the proportional reduction in σ2noise during development. Asymmetry of bilateral symmetric traits then follows:
N(0,DN × (1 - DS)) (3)
where DS ∈ [0,1[ and large values of DS indicate high buffering capacity. Note that 1 is not included in the domain of DS since this would lead to a zero variance. The model hereby assumes that perfect symmetry does not exist in nature [18].
Numerical simulations
In this section the attributes of model (3) are investigated by simulating datasets under different conditions. A range of distributions of DS is evaluated and results are compared with earlier conclusions.
Simulation conditions
Assume that the development of a particular trait of interest experiences the same amount of noise in each individual (i.e. DN constant), but that variation in DS exists. The beta-distribution is a good candidate distribution to model variation in DS because it is bounded between 0 and 1 and can take many different shapes. It is determined by two parameters β1 and β2 that can only take positive values. When both parameters exceed 1 the distribution is unimodal and when β1 equals β2 it is symmetric. When β1<β2 or β1>β2 the distribution is skewed to the right and the left respectively. When both β1 and β2 are smaller than 1 the distribution becomes bimodal. Distributions used here are represented graphically in Figure 1. For each parameter combination, 1000 samples of 10000 individuals were generated in WINBUGS (Version 1.3 freely available at http://www.mrc-bsu.cam.ac.uk/bugs), and the coefficients of variation in DS and DI as well as R were estimated. Mean values were calculated across the 1000 samples to keep stochastic variation minimal.

Overview of distributions of DS that were used to simulate datasets The bottom three rows of distributions are skewed to the left. The same right-skewed distributions (obtained by interchanging β1 and β2) are also used (Table 1)
Results
The beta-distributions applied to model variation in DS generated a broad range of CV values for both DS and DI and of values of R (Table 1). In agreement with earlier results [13, 15], R was closely and positively associated with the CV of DI (Fig. 2). Values larger than 100% were required to obtain relative large values of R (>0.4). However, when examining the relationship at the level of DS, the association was negative (Fig. 2) indicating that only small amounts of variation in DS were required to obtain large values of R. For example, the largest value of R was obtained with a left skewed distribution of DS with a values of CV equal to only 17% (Table 1), hereby lying well within the range of morphological and fitness traits [13].

Relationship between the coefficient of variation (CV) of both DS and instability and the hypothetical repeatability (R) Mean values and their standard deviation were obtained for a range of distributions of variation in DS. Details are provided in Figure 1 and Table 1. The theoretical upper limit of R equals 0.637 and is indicated by a horizontal line
When examining Table 1 and Figure 2 in more detail, the overall negative association between R and the CV of DS did not appear to hold when the distribution of DS was symmetrical. Values of the CV's of DS and DI were identical and in both cases correlated positively with R. Thus, the association between the CV's of DS and R depends on the shape of the distribution of between-individual variation in DS.
Empirical estimates of the distribution of DS: a Bayesian model
In addition to the amount of variation, distributional characteristics of DS have an important impact on the relationship with values of R. As a result, values of R do not consistently reflect variation in DS and distributional characteristics of variation in DS need to be evaluated additionally. Below we first propose a statistical model based on Bayesian statistical principles, to estimate the distribution of DS and then apply it to both simulated and empirical data.
A Bayesian approach
The first step in any Bayesian analysis is to construct the full joint probability model of both the parameters of the model (a vector indicated by θ) and the data (indicated by y) as p(θ,y). This model can be decomposed in a set of sub-models, which are then completed with prior distributions [p(θ)]. In contrast to more traditional methods, parameters are considered to be stochastic rather than fixed. Conclusions about the parameter space θ are made in terms of probability statements conditional on the data y. These probability statements are based on the posterior distribution of each parameter [p(θ|y) = p(θ)p(y|θ)/p(y)] which can either be obtained analytically or by Monte Carlo Markov Chain simulation (MCMC) [19, 20].
Bayesian statistics were introduced into the field of DS and FA to model heterogeneity in measurement error (ME) [5] and to obtain unbiased estimates of DI-fitness associations [17]. One aspect of these models – which we adopt here – was to construct a fully Bayesian mixed-effect regression model. Each observation (i.e. measurement on each side) is modelled as a sample from a normal distribution with mean equal to the unknown trait value and variance equal to the degree of measurement error (σ2ME):

where i = 1..N and j = 1..K with N = number of individuals and K = number of within subject repeats.
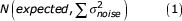
The expected value of a single measurement (i.e. expected [i,j]) is modelled by the sum of a population-specific part (i.e. the fixed-effects) and an individual-specific part (i.e. the random-effects). As fixed-effects an intercept and a slope are included, modelling directional asymmetry. An individual-specific random intercept (interc_ind [i]) and slope (slope_ind [i]) model individual variation in size and asymmetry around this regression line, reflected in ind_profile [i,j]. Random effects are assumed to follow a normal distribution with zero means and variances reflecting variation in size (σ2size) and asymmetry (σ2FA) respectively:
The model is then completed with the following prior distributions [19]:

The parameter estimates obtained from this model have exactly the same interpretation as for the empirical Bayes' approach [21]. However, because each parameter is treated as a stochastic variable, standard deviations become slightly larger [5]. The main importance of this part of the model is to obtain unbiased estimates of individual asymmetry, here treated as distributions instead of fixed values.
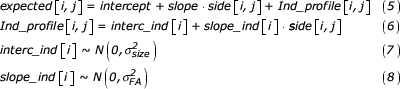
The next step in the model – and this part of the model differs from the previous two approaches – is to establish a link between the observable individual asymmetry and both the unobservable DN and DS. This can be achieved by assuming that each individual asymmetry value reflects a sample from a normal distribution with zero mean and variance σ2FA [i], the latter representing the individual-specific degree of DI [10]. Note that in contrast to equation 8, here each individual is assumed to have a specific degree of DI, or in other words that there is variation in the underlying DI. In agreement with equation 3, DI can be modelled as the joint effect of DN and DS, where DS follows a beta distribution:
The so-called hyperparameters β1 and β2 and DN are given the following prior distribution with a lower limit of zero (i.e. parameters of beta distribution or variances cannot be negative):
N(10,1000) (12)
Posterior distributions of the parameters of interest could in theory be obtained analytically, but in practice our model is to complex. Alternatively, simulation techniques provide a convenient option. The computer package WINBUGS applied here to analyse the different datasets, makes use of MCMC with Gibbs sampling and the Metropolis-Hastings algorithm [19, 20]. In each analysis performed below, 5 independent chains were run with a burn in period of 500 iterations and 1000 iterations from which the posterior distributions were estimated. Each distribution is thus based on 5000 iterations. Convergence was checked with the Gelman and Rubin 'shrink factor' in combination with visual inspection of the chains and their degree of autocorrelation [22, 23]. Unless mentioned otherwise, convergence behaviour was good.
The analysis of simulated data
In order to evaluate the usefulness and limitations of the proposed technique, datasets with six different distributional characteristics of DS and three different sample sizes were generated and subsequently analysed. Posterior means and medians of DN are given in Table 2. These estimates appeared to be biased upward for the two left-skewed (β1>β2) distributions and the bimodal one. For the other shapes of the distribution of DS (see Fig. 3), estimates of DN were more accurate. This result is not unexpected. In left-skewed distributions relatively few individuals are developmentally unstable (i.e. low DS), while those individuals contain most information about the size of DN.

Posterior distributions of DS Posterior distributions indicated by the black bars were obtained for datasets with three different sample sizes (left: N = 500; middle: N = 1000; right: N = 5000) and six different underlying shapes generated from different beta-distributions (row 1: β1 = 2, β2 = 5; row 2: β1 = 1, β2 = 0.5; row 3: β1 = 1, β2 = 0.1; row 4: β1 = 0.1, β2 = 1; row 5: β1 = 0.5, β2 = 1; row 6: β1 = 0.1, β2 = 0.1; indicated by the gray lines)
Figure 3 shows expected and estimated distributions of between individual variation in DS. In most occasions the estimated distribution, although sometimes roughly, approximated the expected distribution (Fig. 3), except for the bimodal case where the peak of developmentally unstable individuals was not detected (Fig. 3 bottom row). In general, and ignoring the bimodal case, the shape of the distribution was detected even so for sample sizes of 500 individuals. Still, in one occasion the MCMC failed to converge. Convergence problems occur even more frequently for smaller sample sizes (i.e. N = 250), but upon convergence the obtained estimate of the distribution reflected the true shape (data not shown).
An example where the method fails
We treat DI as the joint effect of DN and DS (equation 3). Because the observable FA of a trait depends on the magnitude of DI, DN and DS can only be separated statistically from each other under particular conditions. That is when one of the two is held constant (in our simulations we keep DN constant) and when values of the other span the whole range of possible values (between 0 and 1 for DS). Suppose we limit the distribution of between-individual variation in DS between 0 and 0.5 and use a value of DN equal to 1. The variance component DI that leads to the observable FA values, then varies between 1 and 0.5. However, the same range can be obtained for, for example, a value of DN equal to 10 and DS ranging between 0.1 and 0.05. In other words, different solutions are equally likely. This is illustrated by the posterior distributions of DS and DN obtained for this particular example with a sample of 500 individuals (Fig. 4). For both DS and DN multimodal distributions are obtained and the MCMC's did not show convergence. Together with problems of small sample sizes a restricted range of the distribution of DS appears to lead to convergence problems.

Expected (black) and observed (gray) distribution of between-individual variation in DS (top graph) and population level developmental noise (bottom graph)
Patterns in the real world
Analyses of simulated data showed that the presented method provides reliable estimates of the distribution of DS under a variety of conditions. In addition, unless the MCMC failed to converge, the obtained distributions approximated the underlying ones. We therefore assume that convergence offers a good criterion for the reliability of obtained results. We apply the above model to 8 datasets from 5 different species and 7 different traits (Table 3), following the specifications detailed above. In two cases, the MCMC did not converge. The hypothetical repeatabilities in these cases were low (Table 3) and not significantly different from zero. Thus, the available data do not allow concluding that variation in individual DS was present. Distributions of between-individual variation in DS of the remaining six samples – which did show good convergence behaviour – are given in Figure 5. Distributions are remarkably similar in shape, all showing a highly left skewed distribution, irrespective of the value of the hypothetical repeatability. In addition, values of R were not correlated with the degree of variation in DS (Fig. 6).

Between-individual variation in DS as estimated for six empirical datasets

Association between the hypothetical repeatability and the coefficient of variation in DS for six empirical datasets
Conclusions
The strength of the association between DS, DI and the observable degree of asymmetry has been the subject of intense debate in the recent literature [10–15]. In this paper we rescale the current model and treat DS – the presumed biologically relevant trait – as a proportion by which DN is reduced during development. This approach yields three important results. First, in contrast to DI, variation in DS does not need to be unrealistically high to explain observed distributional characteristics of FA. Second, in agreement with findings for DI, highly skewed distributions are required to generate high values of R, the so-called hypothetical repeatability of FA [10]. Third, there appeared no single unique association between variation in DS and R. A method was developed that allows the estimation of DN and of variation in DS simultaneously. Analyses of different simulated datasets revealed that in general the shape characteristics of variation in DS are detected unless it is bimodal or convergence problems occurred. Using this Bayesian model to analyse different empirical datasets revealed that high skewness may be a general property of variation in DS for asymmetry data with both high and low values of R. In addition, values of R may not contain much information on the amount of variation in DS.
Inherent to mathematical modelling, assumptions must be made about the underlying processes that are incorporated in the model. Usually these are oversimplifications of reality. This is likely to be the case here as well. This model makes five fundamental assumptions with respect to DN and DS:
1) Stochastic processes disturb developmental pathways
2) This random noise is additive, independent between traits and follows a normal distribution
3) Noise does not vary between individuals, and thus is not affected by stress or individual genotype
4) Organisms possess mechanisms to buffer their development against stochastic variation
5) The efficiency by which development is buffered varies between individuals
Because relative little research has been conducted on the mechanisms of DN and DS, validation of these assumptions remains difficult and speculative. Recently, Klingenberg [1] reviewed studies that provide evidence for the existence of both DN and DS but emphasises the need for a specific experimental approach. Random variation in concentrations, delays in diffusion and stochastic switching of gene expression are all potential molecular mechanisms of DN but it is not clear if they vary among individuals and/or are affected by stress. Furthermore, mechanisms like gene duplication and stabilisation of proteins by chaperones (e.g. Heat shock proteins) could ensure DS but again the effects of stress are only poorly understood [1]. Finally, the normal distribution of random noise and the independence between two developing traits has been challenged as well. Although the normal distribution appears to fit asymmetry data very well [24], non-linear developmental mapping – which appears to be very widespread [1] – would result in skewed distributions of trait values on left and right. This would in turn result in a leptokurtic distribution of asymmetry values, which appears to be widespread as well [13, 16].
Taken altogether, the model developed here is likely to be a serious oversimplification of reality where distributions of noise may be non-normal and non-additive and where between-individual variation in DN may exist next to variation in DS [1, 2]. However, Bayesian modelling has the desired flexibility to take (some of) these above features into account. When new experiments are being carried out and more insight is gained in the developmental biology of DN and DS, other distributional characteristics and correlations could be incorporated to yield more realistic results. Until then the normal and independent model could be viewed as a convenient approximation of the real phenomena [1].
References
Klingenberg CP: A developmental perspective on developmental instability: theory, models and mechanisms. In: Developmental instability: causes and consequences. Edited by: Polak M. 2002, Oxford University Press, Oxford
Møller AP, Swaddle JP: Asymmetry, DS, and Evolution. Oxford: Oxford University Press. 1997
Leung B, Forbes MR: FA in relation to stress and fitness: effect of trait type as revealed by meta-analysis. Ecoscience. 1996, 3: 400-413.
Bjorksten TA, Fowler K, Pomiankowski A: What does sexual trait FA tell us about stress?. TREE. 2000, 15: 163-166. 10.1016/S0169-5347(99)01788-7.
Van Dongen S, Lens L, Molenberghs G: Recent developments and shortcomings in the analysis of individual asymmetry: Can Bayesian statistics help us?. In: Developmental instability: causes and consequences. Edited by: M Polak. 2002, Oxford University Press, Oxford
Palmer AR, Strobeck C: FA as a measure of DS: Implications of non-normal distributions and power of statistical tests. Acta Zoologica Fennica. 1992, 191: 57-72.
Graham JH, Freedman DC, Emlen JM: Antisymmetry, directional asymmetry, and dynamic morphogenesis. Genetica. 1993, 89: 121-137.
Palmer AR, Strobeck C: FA: measurement, analysis, patterns. Annu. Rev. Ecol. Syst. 1986, 17: 391-421. 10.1146/annurev.es.17.110186.002135.
Van Dongen S: Unbiased estimation of individual asymmetry. J. Evol. Biol. 2000, 13: 107-112. 10.1046/j.1420-9101.2000.00147.x.
Whitlock M: The heritability of FA and the genetic control of DS. Proc. R. Soc. B London. 1996, 263: 849-854.
Whitlock M: The repeatability of FA: a revision and extension. Proc. R. Soc. B London. 1998, 265: 1428-1430.
Houle D: Comment on 'A meta-analysis of the heritability of DS' by Møller & Thornhill. J. Evol. Biol. 1997, 10: 17-20. 10.1007/s000360050002.
Houle D: A simple model of the relationship between asymmetry and DS. J. Evol. Biol. 2000, 13: 720-730. 10.1046/j.1420-9101.2000.00195.x.
Van Dongen S: How repeatable is the estimation of individual FA. Proc. R. Soc. B London. 1998, 263: 1423-1427. 10.1098/rspb.1998.0452.
Gangestad SW, Thornhill R: Individual differences in developmental precision and FA: A model and its implications. J. Evol. Biol. 1999, 12: 402-416. 10.1046/j.1420-9101.1999.00039.x.
Van Dongen S, Lens L: The evolutionary potential of developmental instability. J. Evol. Biol. 2000, 13: 326-335. 10.1046/j.1420-9101.2000.00169.x.
Van Dongen S: Modeling developmental instability in relation to individual fitness: a fully Bayesian latent variable model approach. J. Evol. Biol. 2001, 14: 552-563. 10.1046/j.1420-9101.2001.00315.x.
Swaddle JP, Cuthill IC: The biological relevance of testing for perfect symmetry. Anim. Beh. 1997, 54: 475-476. 10.1006/anbe.1997.0495.
Gelman A, Carlin JB, Stern HS, Rubin DB: Bayesian data analysis. Chapman & Hall, London. 1995
Carlin BP, Louis TA: Bayes and empirical Bayes methods for data analysis. 2nd edition. Chapman & Hall, London. 2000
Van Dongen S, Molenberghs G, Matthysen E: The statistical analysis of FA: REML estimation of a mixed regression model. J. Evol. Biol. 1999, 12: 94-102. 10.1046/j.1420-9101.1999.00012.x.
Gelman A, Rubin DB: Inference from iterative simulation using multiple sequences (with discussion. Statistical Science. 1992, 7: 457-511.
Cowles MK, Carlin BP: Markov chain Monte Carlo convergence diagnostics: a comparative review. J. Amer. Statist. Assoc. 1996, 91: 883-904.
Van Dongen S, Lens L, Molenberghs G: Mixture analysis of asymmetry: modelling directional asymmetry, antisymmetry and heterogeneity in FA. Ecology Letters,. 1999, 2: 387-396. 10.1046/j.1461-0248.1999.00103.x.
Van Dongen S, Sprengers E, Löfstedt C, Matthysen E: Heritability of tibia FA and developmental instability in the winter moth (Operophtera brumata L.) (Lepidoptera, Geometridae). Heredity. 1999, 82: 535-542. 10.1046/j.1365-2540.1999.00523.x.
Van Dongen S, Sprengers E, Löfstedt C: Lack of evolutionary potential of DS in the Indian meal moth Plodia interpunctella. Belgian J. Zool. 2001, 131: 75-82.
Lens L, Van Dongen S S: Evidence for organism-wide asymmetry in five bird species of a fragmented afrotropical forest. Proc. R. Soc. B London. 1999, 266: 1055-1060. 10.1098/rspb.1999.0743.
Acknowledgements
Both authors hold a Postdoctoral fellowship with the Science Fund Flanders (FWO Vlaanderen). We thank Eevi Karvonen, Juha Merilä and Pekka Rintamäki for making the greenfinch data available for analysis.
Author information
Authors and Affiliations
Corresponding author
Additional information
Authors' contributions
SVD performed the simulations and statistical analyses and drafted the manuscript.
LL is leading scientist of the Kenyan bird studies and drafted the manuscript.
Authors’ original submitted files for images
Below are the links to the authors’ original submitted files for images.
Rights and permissions
About this article
Cite this article
Van Dongen, S., Lens, L. Modelling developmental instability as the joint action of noise and stability: a Bayesian approach. BMC Evol Biol 2, 11 (2002). https://doi.org/10.1186/1471-2148-2-11
Received:
Accepted:
Published:
DOI: https://doi.org/10.1186/1471-2148-2-11